
Official data and public video: what the timestamps can prove
A feed described as official and a price shown as live answer different questions. Official can identify the provenance and rights of data. It does not, by itself, specify the delay of a particular subscription, the sportsbook's processing time or the age of a quote in your browser. To compare channels, identify the product, event and measurement endpoints before attaching a number to the gap.
The recommendation is to keep a timing record rather than rank providers or operators from an animation. This guide contains no captured sportsbook traffic or commercial feed measurements. Its numerical timelines and probabilities are constructed examples. They do not establish that a particular platform always updates first, accepts a price during a pause or settles a restored round in one universal way.
The product matters as much as the provider name
GRID advertises sub-200ms P95 on core live feeds, with scoped service levels. This vendor claim does not measure a bookmaker’s complete downstream path or every event.
The dated 2022 GRID Open Platform agreement, section 3.2, described broadcast-delayed data. That historical product statement does not specify today’s commercial service.
Record the actual product and permitted use, covered event and delivery mode. A sample payload or public documentation does not show that your operator subscribes to it. A fast vendor feed also does not establish a precise time for pricing, publication, frontend display and final acceptance. Bayes, GRID and other names should not be used as interchangeable proof of a complete measured pipeline.
Choose endpoints before calculating latency
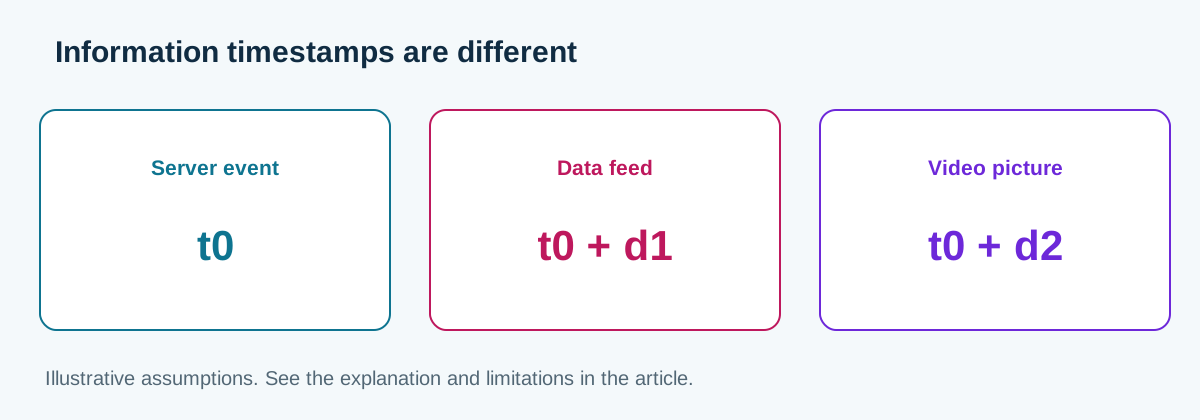
The following example uses one synchronized hypothetical clock and the same identifiable event throughout. Event time, subscriber receipt, price publication, browser rendering and wager response are different endpoints. If the event timestamp or clock alignment is unavailable in a real observation, leave the corresponding segment unknown. Do not recover it from a guessed standard delay.
t_event = 0.0 s
t_subscriber = 0.2 s
t_price_published = 0.6 s
t_browser = 1.4 s
t_video = 40.0 s
t_request = 41.0 s
t_response = 46.0 s
t_video - t_browser = 38.6 s
t_response - t_request = 5.0 s
In that example, event-to-subscriber latency is 0.2 seconds, event-to-price publication is 0.6 seconds and event-to-browser rendering is 1.4 seconds. The video reaches the viewer 38.6 seconds after the illustrated browser update. The response at 46 seconds is not evidence that the data provider took 46 seconds. Nor does it reveal which processing step accounted for the interval after submission.
Public video has its own production and playback path. A low-latency player setting does not establish the intentional delay upstream. A displayed game clock can stop while wall-clock time advances. A restream can add another transformation. The stream-delay guide explains the consequences for a probability estimate; no single 30–90 second range is treated here as universal.
If comparing two visible scoreboards, verify the event, map, round and update identity. Screens that appear to disagree may be reporting different moments or different selections. A video replay must not be logged as a fresh event. Keep the observation time separately from any source timestamp, including timezone and clock precision. Otherwise a precise-looking subtraction can describe the wrong pair of events.
An event during a countdown is not a rejection probability
Under an explicitly hypothetical homogeneous Poisson process with event rate 0.085 per second and a six-second interval, the chance of at least one event is 39.950442%. This assumes a constant rate and independent increments. It is not a measured CS2 kill rate, and it does not say that the request will be rejected whenever an event occurs.
lambda = 0.085 / s; tau = 6 s
P(E) = 1 - exp(-lambda × tau) = 0.3995044212
P(E) = 39.950442%
P(R | E) = 0.70; P(R | no E) = 0.10
P(R) = 0.70 × P(E) + 0.10 × (1-P(E))
     = 0.3397026527 = 33.970265%
lambda = 0 => P(E) = 0 => P(R) = 0.10
In the second calculation, the assumed rejection chances are 0.70 when an event occurs and 0.10 when none occurs. The resulting rejection probability is 33.970265%. These are invented conditional rules to show the distinction. Even when the modeled game-event rate is zero, the assumed 0.10 rejection probability remains. A static game state therefore does not logically guarantee acceptance of a displayed price.
Record what happened rather than infer an internal rule: submitted, pending, rejected, offered a revised quote, accepted and later settled or voided. A changed price is not identical to a rejection, and rejection is not a settled loss. You do not need to place forty test bets to produce an audit. Start with the documented process or a paper record, without manufacturing turnover.
A reference probability is not a verified true chance
Consider a complete hypothetical two-way market at 1.80 and 2.00. Its booksum is 1.055555556, overround 5.555556% and theoretical hold 5.263158%. Proportional normalization gives probabilities 10/19 and 9/19. An additive adjustment gives 19/36 and 17/36. Under the stated two-outcome Shin formulation, those additive probabilities are also the solution. Different assumptions can yield different references.
qA = 1/1.80; qB = 1/2.00; S = qA + qB = 19/18
Overround = S - 1 = 5.555556%
Hold = 1 - 1/S = 5.263158%
Proportional: pA = 10/19; pB = 9/19
Additive: pA = 19/36; pB = 17/36
Shin: p_i = (sqrt(z² + 4(1-z)q_i²/S) - z) / (2(1-z))
sum(p_i) = 1 => pA = 19/36; pB = 17/36
Reference comparison = 2.20 × (17/36) - 1 = +3.888889%
Separate hypothetical pB = 0.42
EV(2.20) = 0.42 × 2.20 - 1 = -7.6%
A comparison of a taken price 2.20 with reference probability 17/36 is +3.888889%. If a separate hypothetical outcome model instead assigns probability 0.42, EV at 2.20 is -7.6%. The positive reference comparison has not proved a positive true edge. It also cannot establish the fraction of insiders in the customer base from a fitted Shin parameter.
Do not compare prices from different game states and call the difference proof of forecasting skill. A later freeze time can contain another round, changed economy or a substitution. Keep those changes in the record. The timeout reading concerns related tactical inputs; it does not certify a pause as a synchronized or profitable execution window.
Technical restoration and wager settlement are separate questions
A server restart, replayed round or technical pause is an event fact. It does not identify the rule for every wager. Read the exact operator's applicable terms for the title, market and time of acceptance. Check whether the selection concerns the round, map or series, whether it had already been determined and which official event decision is relevant. Do not infer a refund from the word rollback alone.
Save the ticket reference, accepted time and price, event notice, applicable rule version and the final settlement explanation. A pending review is not a void, and a void is not automatically the same monetary result as a loss. In a simplified full-refund, no-fee case, returned stake produces zero net wager profit; fees or currency conversion require their own accounting.
Compare equivalent offers using the market-selection guide. Keep modeled price quality, accepted amount, timing and settlement evidence separate. If one of those is missing, state the missing field. A latency story does not fill it, and a seemingly fast interface does not prove either a favorable forecast or a future payout.