Mistake: using a Bo3 probability to price a Bo1
Define the event before the price
The error is to borrow confidence from a different event. A team's chance of winning one selected map is not automatically its chance of winning a series. This remains true even when the lineup, opponent and date are unchanged. A Bo1 contains one map; a Bo3 is decided by reaching two map wins under the specified rules. Quoting a series probability beside a single-map price makes the expected-value calculation answer the wrong question. It can be wrong even if the bettor correctly identifies the stronger team. There is no need to invent a professional losing sample to demonstrate that mismatch: explicit conditional arithmetic is enough.
First record exactly what the ticket pays on: match winner, named map winner, map handicap, round handicap or total rounds. Check format, possible map advantage, walkover and retirement rules. A match-winner label does not imply the same event at every stage. Do not assume the current tournament follows another tournament's Swiss schedule. Verify its published rules and the actual fixture. The examples here use ordinary completed Bo1 and Bo3 matches, without a starting advantage, void or draw. Those restrictions are part of the model, not a claim that all professional events share one format.
The conditional series calculation
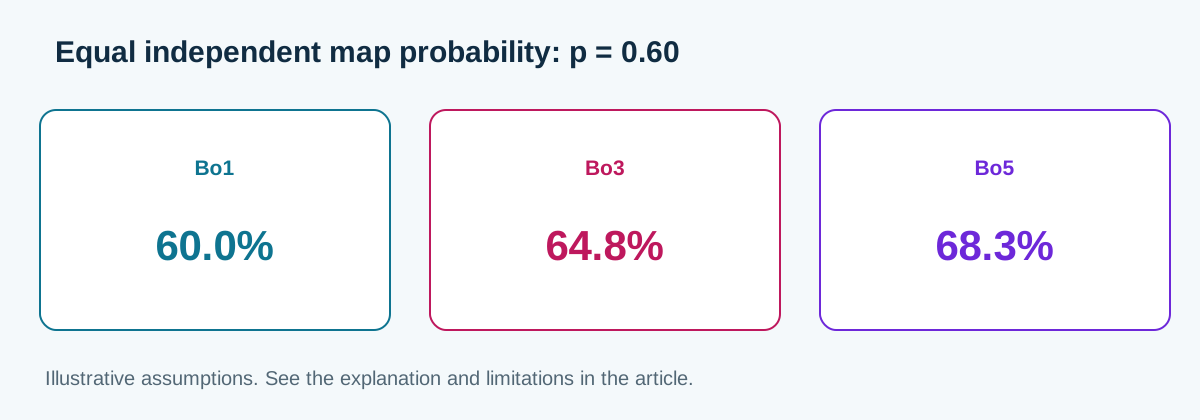
Assume each possible map is independent and team A wins each with the same probability p. A wins a Bo3 through WW, WLW or LWW. Summing those mutually exclusive paths gives p² + 2p²(1−p). The Bo1 chance is simply p. With the invented input p=0.70, the series chance is 0.784, whereas the single-map chance stays 0.70. At a hypothetical quote of 1.28, the Bo1 EV is −10.4% per unit; the series EV would be +0.352%. That tiny positive series result follows from the chosen rounded quote, not from a discovered bookmaker error. Changing the event changes the relevant probability.
The formula needs its assumptions. If map one, map two and the decider have independent probabilities p1, p2 and p3, the series probability is p1p2 + [p1(1−p2)+(1−p1)p2]p3. For invented values 0.76, 0.48 and 0.68, it is 0.711872. The sweep chance is 0.3648, not the series chance. If probabilities change after earlier outcomes, use path-conditional probabilities instead of pretending the same p3 applies everywhere. A series calculator using independent map inputs illustrates that assumption; it does not estimate map strength from team names or validate correlation corrections.
Illustrative independent-map model:
P(Bo1)=p
P(Bo3)=p*p+2*p*p*(1-p)
p=0.70: P(Bo3)=0.784; fair Bo1=1/0.70=1.428571
At d=1.28: EV_Bo1=0.70*1.28-1=-10.4%
EV_Bo3=0.784*1.28-1=+0.352%
Unequal maps: 0.76*0.48+(0.76*0.52+0.24*0.48)*0.68=0.711872
p=0.84: upset Bo1=0.16; upset Bo3=0.068608
Upset-frequency ratio=0.16/0.068608=2.332090
No universal odds floor:
0.85*1.28-1=+8.8%; 0.50*1.80-1=-10%
Before veto: 0.50*0.60+0.50*0.80=0.70
After first map confirmed: p=0.60, not 0.70
Format is not a universal variance multiplier
For identical independent maps and p above one half, Bo3 increases the favorite's win chance relative to Bo1. At p=0.50 it leaves the chance unchanged; below one half it decreases A's win chance. The size of the change depends on p. A ratio of upset frequencies is also not a ratio of variances. With p=0.84, the Bo1 upset chance is 0.16 and the Bo3 upset chance is 0.068608, so the ratio is about 2.332090. That is one conditional comparison, not a universal 2.3x MR12 multiplier. Return variance additionally depends on the payout, stake and dependence between positions.
Likewise, two pistol wins do not guarantee a map upset. Under a specified first-to-thirteen regulation format, two wins are 2/13 of the target count. Adding two successful following rounds gives 4/13 = 30.769231%. Neither fraction is a map-win probability or a minimum improvement in it. The second pistol is future information until it occurs. A pre-match model may assign a distribution over pistol paths, but it cannot condition on the eventual sweep when evaluating an earlier decision. Economy can connect round outcomes, so an independent-round illustration should remain an illustration rather than a professional conversion forecast.
Veto and information available at decision time
A Bo1 forecast should concern the map that will actually be played. Before the veto, assign explicit probabilities to possible maps rather than selecting the most favorable one afterward. For an invented example, weights 0.50 and 0.50 on maps with A probabilities 0.60 and 0.80 give a blended chance 0.70. After the first map is confirmed, use 0.60 if the underlying estimates remain appropriate. At quote 1.50, EV changes from +5% for the hypothetical blend to −10% on that confirmed map. The change illustrates conditioning; it does not show that a market must leave the earlier price available.
Veto predictions need evidence about the actual eligible pool, ban order and team behavior at the time. A recent map record can reflect opponent strength, repeated lineups, side allocation and selective picks. A 70% historical win rate is not automatically a 70% chance against today's opponent. Record sample size and missing matches, and separate map-specific evidence from a broad ranking. Broad preparation does not prove that a favorite will neglect an underdog's preferred map. A map can be banned, and a familiar opponent can adapt. Save the pre-veto forecast so that later knowledge cannot quietly improve the original selection.
A handicap is a separate event
A round handicap is not insurance with a guaranteed fair premium. Under completed regulation first-to-thirteen scoring, B +3.5 wins at an A 13–10 result because B's deficit is three. It loses at 13–9 because the deficit is four. B +4.5 wins at 13–9 and loses at 13–8. These are settlement examples, not coverage probabilities. A map-win estimate alone does not determine how probability is distributed across losing margins. Two forecasts can give B the same map-win chance but very different handicap chances. Model the required margin event directly and compare it with its own accepted quote.
Overtime treatment matters for handicaps and totals. A close route to overtime does not guarantee a +3.5 cover: if counted in full, a 16–12 result has a four-round margin. Read the operator's exact market rule instead of treating every overtime as a narrow result. A total also asks another question. In the specified regulation format, 13–9 totals twenty-two and 13–8 totals twenty-one. Thus Under 21.5 and B +4.5 can settle differently even on the same map. Their dependence must be considered when combining positions; multiplying their marginal probabilities without justification gives an unsupported joint price.
Stake and review the actual accepted position
There is no universal 1.55 minimum price for a Bo1 favorite. At hypothetical probability 0.85, price 1.28 has EV +8.8%; at probability 0.50, price 1.80 has EV −10%. These inputs are illustrative, not recommended forecasts. A price threshold by itself cannot establish value. Use EV = p×decimal odds−1 for an ordinary win/lose wager at the accepted quote. The offered odds already include the price effect of the market's margin; do not subtract that same margin again. Fees or different settlement outcomes need their own cash flows. A loss on one ticket does not establish that its original expectation was negative.
Stake sizing cannot rescue the event mismatch. For a single isolated win/lose wager with known p and decimal odds d, unconstrained Kelly is (pd−1)/(d−1). A negative output does not justify a positive stake on that selection. A chosen fraction reduces exposure but does not prove p. There is no universal half-unit amount that guarantees survival or makes Bo1s profitable. Record total exposure across related map, series and handicap tickets, plus accepted stake and price. Keep probability revisions, rejected requests and passes in the review. Compare later comparable forecasts with outcomes and pricing references while preserving uncertainty. Positive closing-line comparison remains a diagnostic, not proof of true edge or future profit.